A business associate recently forwarded a white paper by one of the global BI software companies with the comment “… it all sounds so simple, yet we both know the complexities are just under the table.” Like all good marketing materials, this white paper talked about the current pain of the target audience and provided glowing examples of a possible solution. Part of the proposed solution included this: free yourself from expensive consultants by bringing the power of predictive analytics in-house.
Coincidentally, this white paper arrived while I was working through the intricacies of sales transactions for a client who is looking for quick – and accurate – ways to answer questions like “What happened to my sales?” and “What happened to my margin?” Both are high level questions that require a thorough understanding of “low level data” in order to provide meaningful answers. This got me thinking about the complexities of performing predictive analytics.
Complexities lurking under the predictive analytics table include issues such as data quality. For instance,
- Customer IDs and customer names not always matching
- Customer ratings changing over time
- Master invoices being used to track transactions over an extended period of time
- Inconsistent data entry – for instance, credits sometimes showing up as negative numbers and sometimes as positive numbers – depending on how the data entry person coded the transaction.
More important than data quality is the question of “how do we interpret what we see?” Statistical outliers serve as an example here, since they do not require a lot of explanation and their meaning is open to interpretation. They could be the first sign of a new trend, a fluke, a data error, or the result of factors beyond our control. How we deal with outliers when building our predictive model depends on what caused them.
Non-repeatable exceptions, a.k.a. flukes, are meaningless when we are trying to build a model of the future. Usually they are noise and become part of our margin for error rather than a factor we would include in our model. In order to separate meaningful facts from flukes, we need to dig further into the details and determine their influence on the big picture.
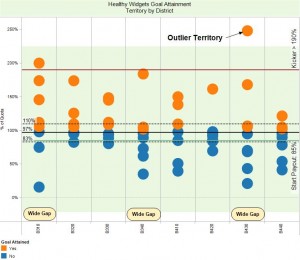
For example, the chart below shows an “Outlier Territory” that performed particularly well in terms of achieving sales goals.
As we refine our bonus plan for the next pay period, how should we proceed? Should we assume this territory will continue to have high sales and therefore raise its quota? The answer depends in part on whether we are dealing with
- A real issue, such as our bonus model not working for that territory, or
- A fluke, like a one-time-only buy in by a major customer, or
- Data errors, as in “somehow we summed up the sales data incorrectly,” or
- Factors beyond our control, like an uptick in demand because of an unexpected and short-lived emergency.
Sometimes the sales rep can provide the insight we need to understand what caused the outlier. Usually, though, we need to look for likely causes using the data we already have and relating it to information from other sources.
As we can see, our crystal ball is only as good as the answers we derive from data collected in the past. Building it also requires us to make assumptions about how pieces fit together, how they influence each other and how important they are in shaping the future. We can improve our assumptions using statistical tools like t-Tests, ANOVAs and various regression models. We can look to proxies and draw on our understanding of the market place. No matter how we develop our assumptions, we need to understand their limitations or they might turn us into Jacks and Jennys down the road.
Long story short: to build a crystal ball we need more than powerful tools. We need skilled and experienced people, good data and the commitment to adapt over time.

